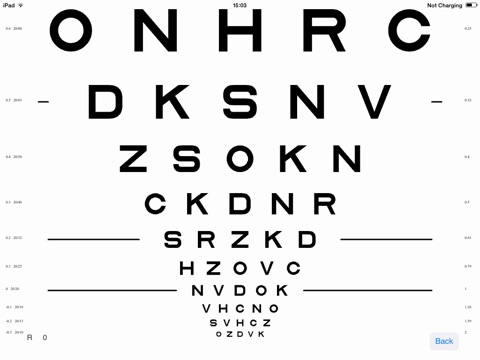
VisionC (ETDRS Visual Acuity)
App for measuring the Visual Acuity and Contrast Sensitivity with dynamic Charts at multiple distances (Normal or Low Vision Patients)
Normal Vision
1.- ETDRS Charts for presenting at 0.40, 0.67, 0.80, 3 and 4 meters.
2.- 3 Different packages of letters for avoiding memorization.
3.- Contrast Variation from 0 to -2.3 log units in -0.1 log unit steps for measuring visual acuity 4.- at different conditions of contrast.
5.- Isolated Crowded Sloan letters for measuring poorer visual acuity values than the limited 6.- for the screen size in an ETDRS chart.
7.- Contrast Variation from 0 to -2.3 log units in -0.1 log unit steps for measuring contrast at a fixed value of visual acuity.
Low Vision
1.- ETDRS Chart for presenting at 1 meter. From 0.2 to 1.1 logMAR [20/32 to 20/253]
2.- Contrast Variation from 0 to -1.9 log units in -0.1 log unit steps for measuring visual acuity 3.- at different conditions of contrast.
4.- Isolated Crowded Sloan letters for measuring poorer visual acuity values than the limited for the screen size in an ETDRS chart. Up to 1.6 logMAR [20/800]
Special Technical Issues
1.- These issues makes the app the most proffesional in terms of personalization to maximize reliability.
2.- Tablets pixels per inch. The dots per inch (dpi) from your device is automatically recovered from the device and displayed in the screen.
3.- Gamma correction. Optimize the contrast of the letters in your device by means of inserting your own calibration data.


